I generally use matplotlib to generate figures for scientific papers and presentations. Here are a few tips.
Fonts in figures
I prefer to use Helvetica as the typeface in all of my figures. This can be accomplished in matplotlib, following these instructions.
Using this approach, almost all of the text in your figures will be in Helvetica, except for those in math mode. For example, if you wish to indicate units with an exponent in, say, your x-axis label (e.g., something like plt.xlabel('Discharge [m$^3$ s$^{-1}$]')), the superscripted exponents will still be in the default matplotlib font, DejaVu Sans, and not Helvetica. Similarly, italicized symbols (such as Sediment flux $Q_s$ [t s$^{-1}$]) will remain in DejaVus Sans, while the rest of the text is Helvetica. This looks a little janky. (I made the axis labels extra big to make it easier to compare; this also looks a little janky.)
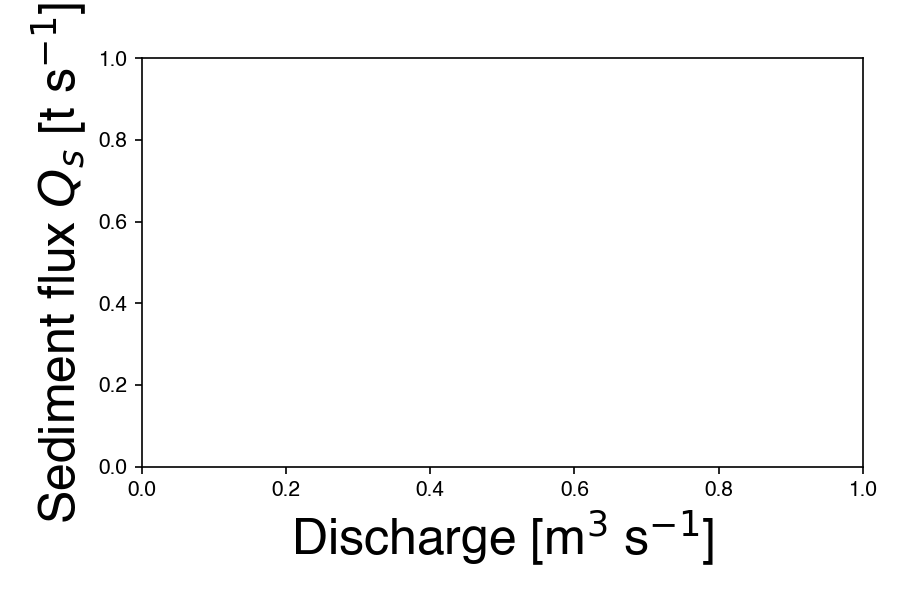
See how Qs, 3, and –1 look different? You can enable Helvetica in math mode with the following lines to keep the typeface consistent:
params = {'mathtext.fontset': 'custom', 'mathtext.it': 'Helvetica:italic'}
plt.rcParams.update(params)
The result will look like this:
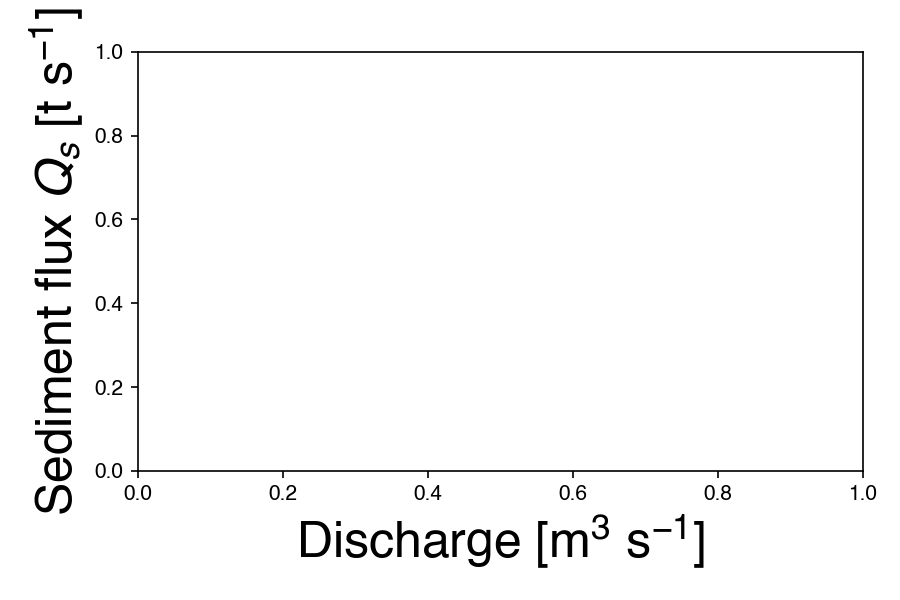
Much better!