Analyzing fuel economy of a cross-country road trip
In July 2018 I drove from Maine to Santa Cruz, California, and kept track of the fuel economy of my vehicle and the location of each fill-up. On the map below, both the color of each symbol and its size indicates gas mileage. You’ll note my vehicle (a 2000 Toyota Land Cruiser) isn’t that great on gas, although it is awesome on a road trip.
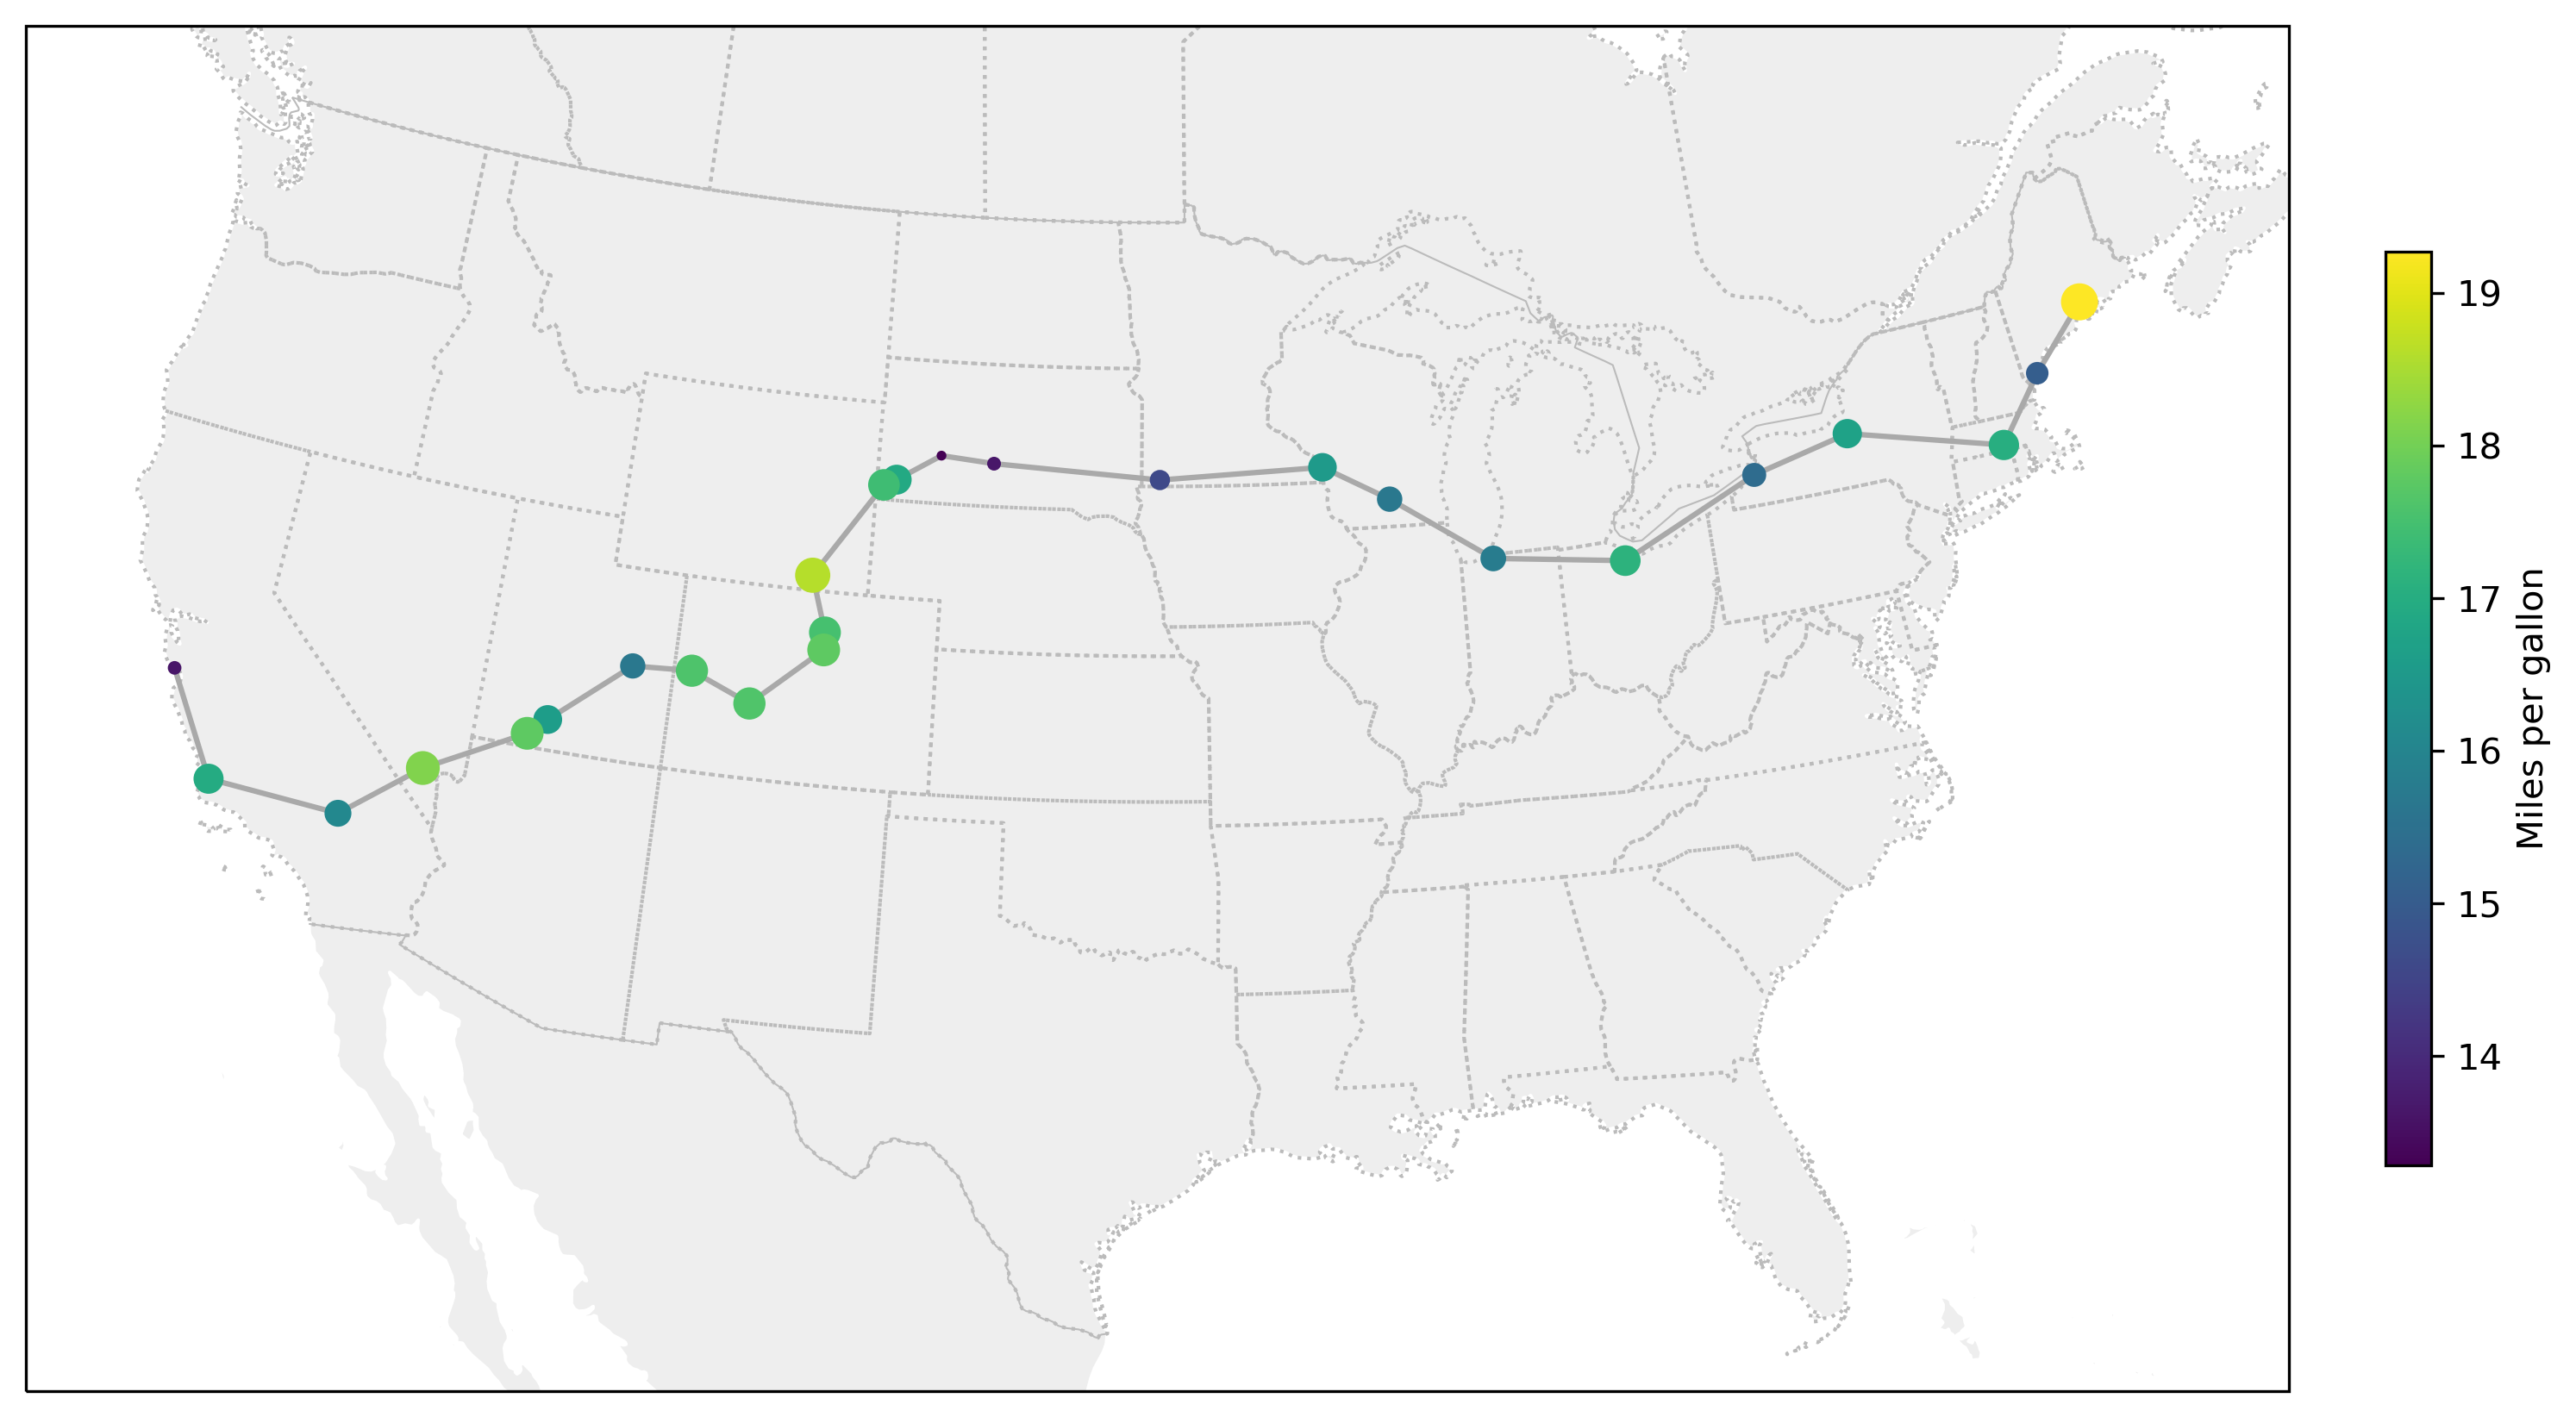
Things started off great, with a trip-topping MPG of 19.3 at the first fill-up in Bucksport, Maine. Fuel economy stayed in the mid teens through Wisconsin, but started to get grim in western Minnesota and, especially, South Dakota. I-90 through South Dakota is straight and fast—the speed limit is 80 miles per hour most of the way. This was a big day; I drove about 600 miles to make it to the Badlands by nightfall. Those factors plus daytime temperatures over 100 °F and a rooftop box resulted in the worst fuel economy of the trip (13.3 MPG in Wall, SD, for those keeping score).
After that Wall fill-up, economy improved as I slowed down and began a greatest-hits visit of national parks, starting with Badlands and ending at Zion. Even the day that the Land Cruiser climbed from 5,130 ft to 12,183 ft, in Rocky Mountain National Park, averaged a relatively respectable 17.5 MPG.
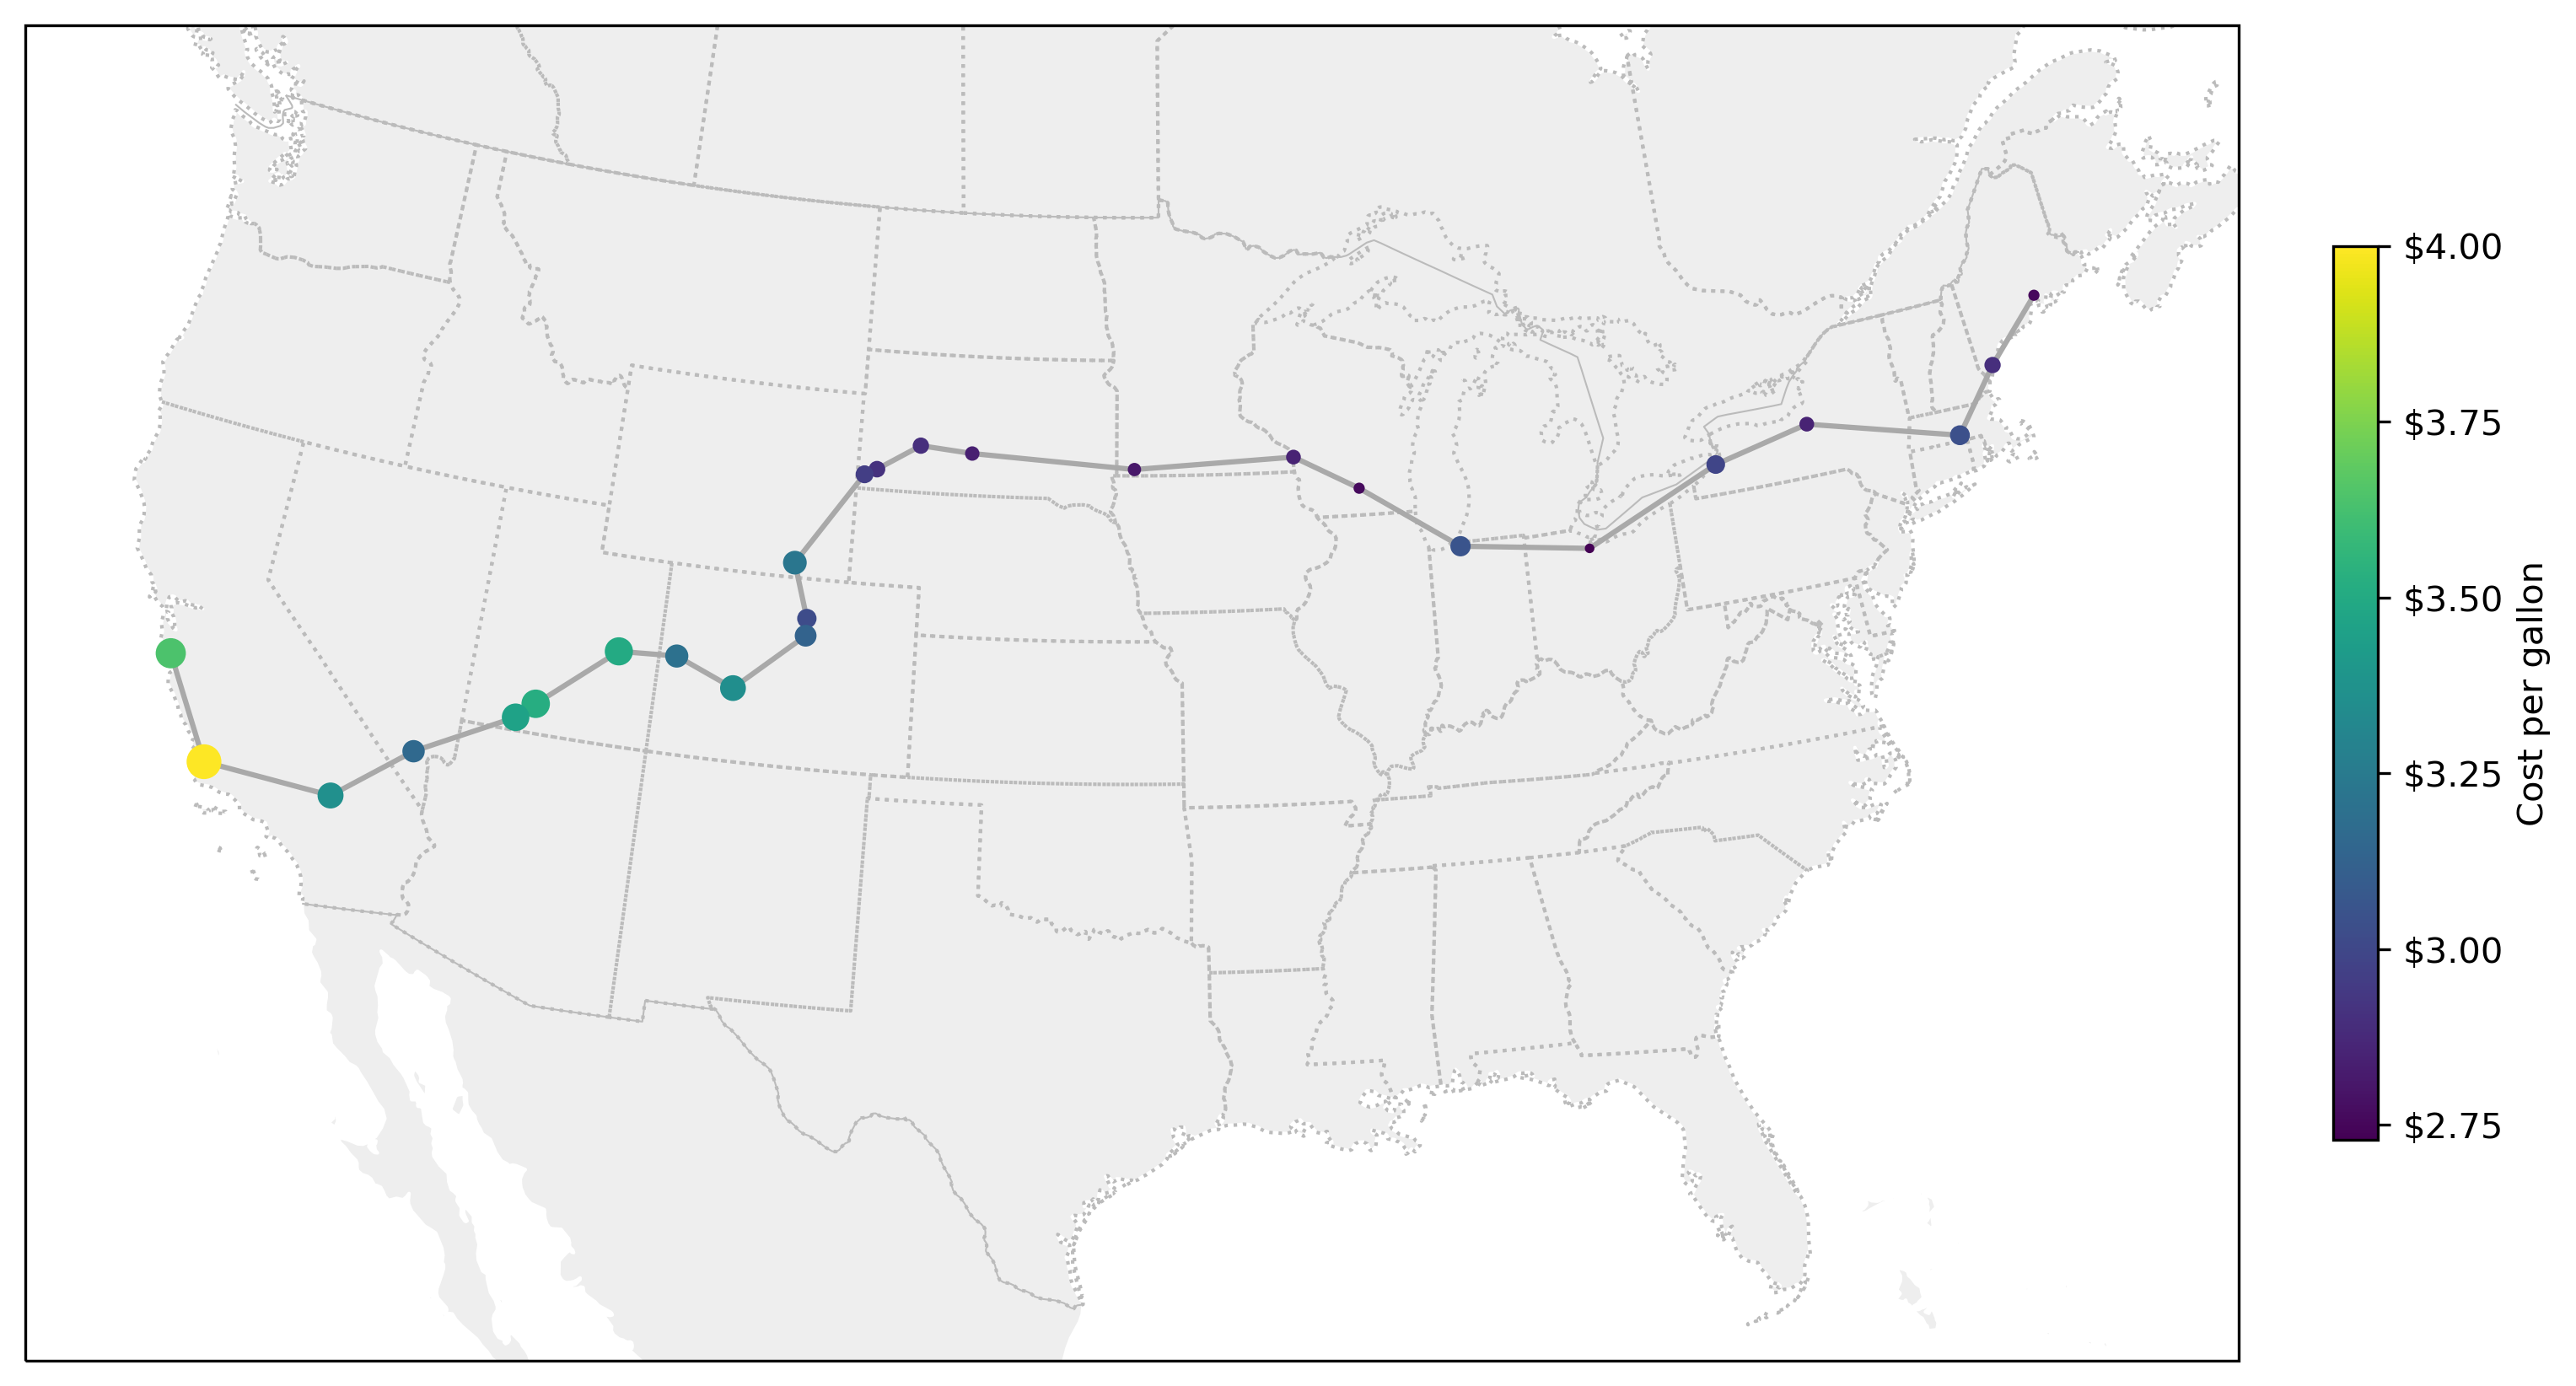
The spatial distribution of prices shows how much more expensive gasoline is in the western states than the midwest and east.
By the numbers
- Total distance: 5323 mi (approximately equivalent to my typical total annual miles driven)
- Total fuel consumed: 338.6 gal (8.0 bbl)
- Total fuel cost: $1052.91
- Average price: $3.107/gal
- Maximum price: $3.999/gal (Santa Maria, CA)
- Minimum price: $2.729/gal (Clyde, OH)